Learning
What is a Scatter Chart Useful For?

Scatter charts serve a crucial role in data analysis, providing illustrative representations of correlational relationships. They offer a unique perspective that is suited for uncovering patterns in large amounts of data. By understanding the practicality of scatter charts, it’s possible to make better data-driven decisions. In this article, we will uncover the utility and application of scatter charts in different industries.
Understanding Scatter Charts: An Overview
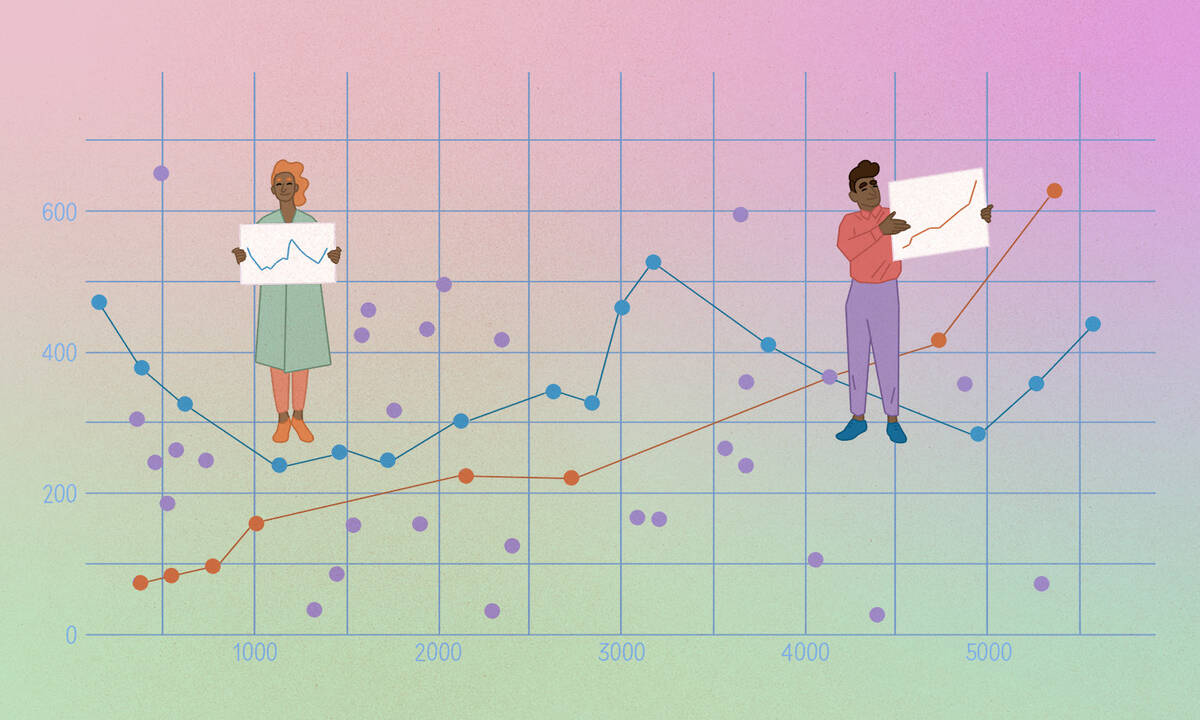
So, what is a scatter chart? In simplistic terms, a scatter chart uses dots to represent the correlation between two numeric variables. The position of each dot on the horizontal and vertical axes indicates the values for those variables, giving a quick visual display of any relationship or pattern.
Scatter charts are primarily used for visualizing relationships between numerical variables. They can display a range of correlations – from strong positive or negative, indicating a clear relationship, to none, indicating no relationship. Understanding scatter charts is fundamental in multiple sectors, enabling key insight into analyses like safety reports, economic patterns, and market research trends, among others.
Despite their seemingly complex nature, scatter charts are relatively easy to understand and interpret once their mechanics are mastered, allowing for a wide array of applications.
The Basic Elements of a Scatter Chart
The principal components of a scatter chart are the X and Y axes and the data points. The X-axis (horizontal) typically represents an independent variable, while the Y-axis (vertical) represents a dependent variable.
The data points or dots in the scatter plot represent the observed values of both variables. The way these points are scattered on the chart gives us a visual idea of any relationship or correlation between the variables.
Additional elements may include a line of best fit or trend line, which aggregates the overall pattern of the data, and a title and labels to provide context to viewers.
Effectively understanding and utilizing these elements in a scatter chart can optimize its readability and utility for data analysis.
Detailed Uses of Scatter Charts in Different Industries
In the business industry, scatter charts are used to identify relationships between variables such as sales and profit margins, customer age and spending behavior, and manufacturing costs and outputs. This can enhance data-informed business decisions and strategy planning.
Within the scientific community, researchers might use scatter charts to depict relationships between variables such as temperature and plant growth or medication dosage and patient response. This can inform conclusions and further investigations.
In the economic realm, scatter charts could exhibit correlations between factors like income and consumption or unemployment rates and economic growth, aiding in policy development and forecasting.
These examples illustrate the versatility of scatter charts in a variety of decision-making contexts, underscored by their utility in uncovering and understanding intricate correlations.
Using Scatter Charts for Trend Analysis
Scatter charts promote effective trend analysis by providing a concise visual representation of large data sets. The benefit here is the simple interpretation of complex data.
By plotting historical data on a scatter chart, analysts can identify trends over time. Pinpointing these trends can inform predictions about future behavior or results, proving invaluable in strategic planning.
Furthermore, scatter charts allow for the inclusion of multiple sets of data on a single chart. This capacity to layer data sets empowers a holistic view of trends across different variables or over differing time frames.
Overall, using scatter charts for trend analysis equips professionals with a potent tool in their analytical arsenal for driving data-based strategies and predictions.
Altogether, scatter charts are key in transforming complex big data into straightforward visuals, enabling you to identify patterns, make predictions, and make confident and informed business decisions. They allow anyone, from business professionals to researchers, to see the bigger picture and draw meaningful conclusions based on trends and correlations.


