Tech
3 Uses for Data Visualization Software

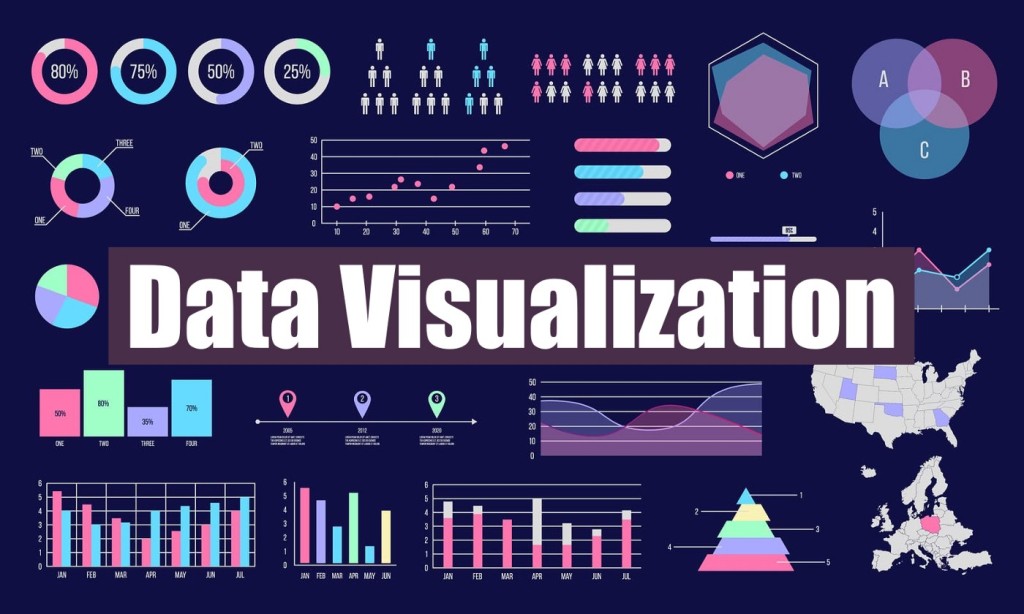
Data visualization is the process of translating information into a visual form, such as a graph or map, to make data simpler for us to understand and examine insights with. The primary purpose of data visualization is to make it easier to recognize trends, patterns, and outliers in data sets.
Data visualization is often referred to as information graphics, information visualization, and statistical graphics. This term isn’t just a throwaway phrase used by industry experts and professionals to make themselves sound intelligent. Regardless of industry or size, modern businesses generate a massive amount of data.
However, this enormous amount of data, whether from individuals, computers, or other sources, don’t give professionals any valuable insights by itself.
That’s where data visualization software comes into play. Visualization software tools can collect, organize, and make data comprehensible so business professionals can analyze the data for useful insights. But what uses does this software have? Today, we’ll explore data visualization software and three excellent ways to use it.
1. More Convenient, Faster Access to Valuable Data Insights
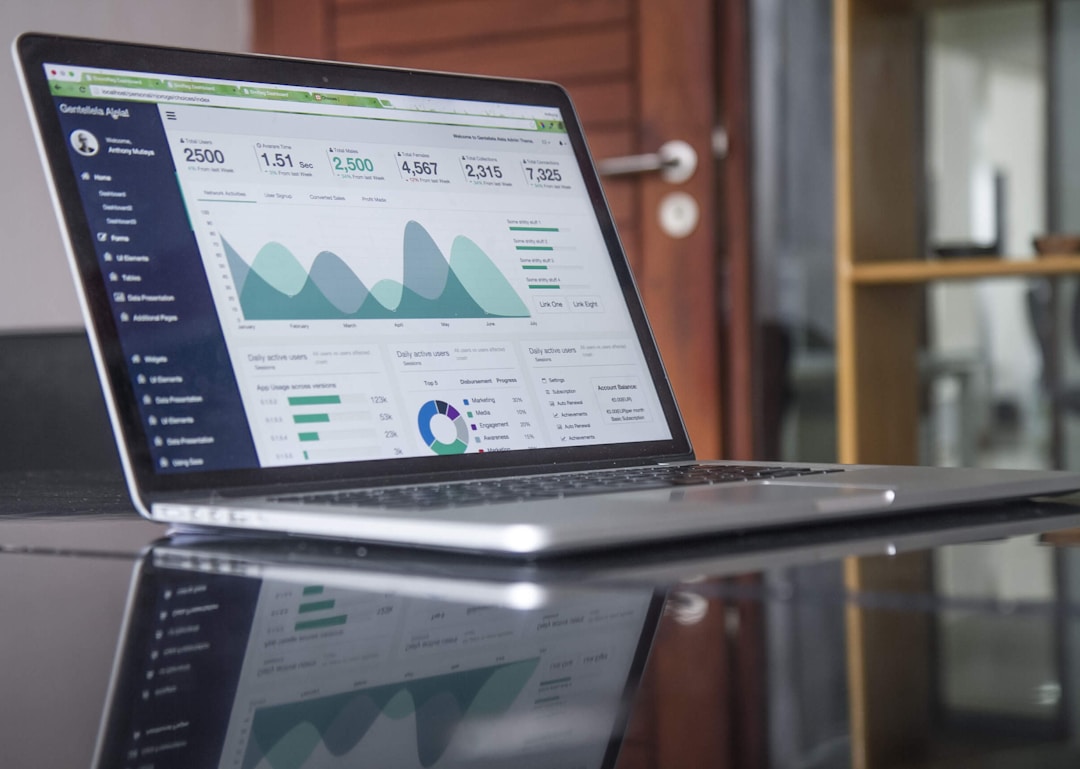
Visualization software’s primary use is to help businesses increase the speed at which they process, organize, and present data. This software automates this aspect of analyzing data and presents it to users in a graphical form, such as a pie chart, a bar graph, or other methods. As a result, companies can process their data, make fewer mistakes, and record valuable insights much faster than with traditional methods.
In fact, with the vast amount of information that any company produces today, it can be next to impossible for even a team of people to make it through the data, organize it, and present it anywhere close to the speed of visualization software.
In this way, companies can increase their decision-making speed, take advantage of industry trends, and gather customer information while the insights are still applicable. Of course, missing out on an industry trend due to poor data analytics can spell disaster for some companies, but that shouldn’t be an issue with data visualization software.
2. More Effective and Productive Workplace Communication
The typical business report is a set of formal documents filed with static tables, charts, and loads of text. These reports may be comprehensive, detailed findings. However, they can become so elaborate that the bulk of the valuable information is lost or difficult to present.
When visualization software is employed, it can generate reports that are easier to understand and get the point across much faster.
Visualization software allows users to present complex data and simplify it for more effective communication and decision-making. In addition, through this software’s graphics, it’s easier to interpret large amounts of data from various sources with interactive features and visual tools like heat maps, bubble maps, and fever charts.
As a result, this software can help create a more memorable presentation where information isn’t lost in translation.
3. Real-Time Data for Advanced Sales Analysis
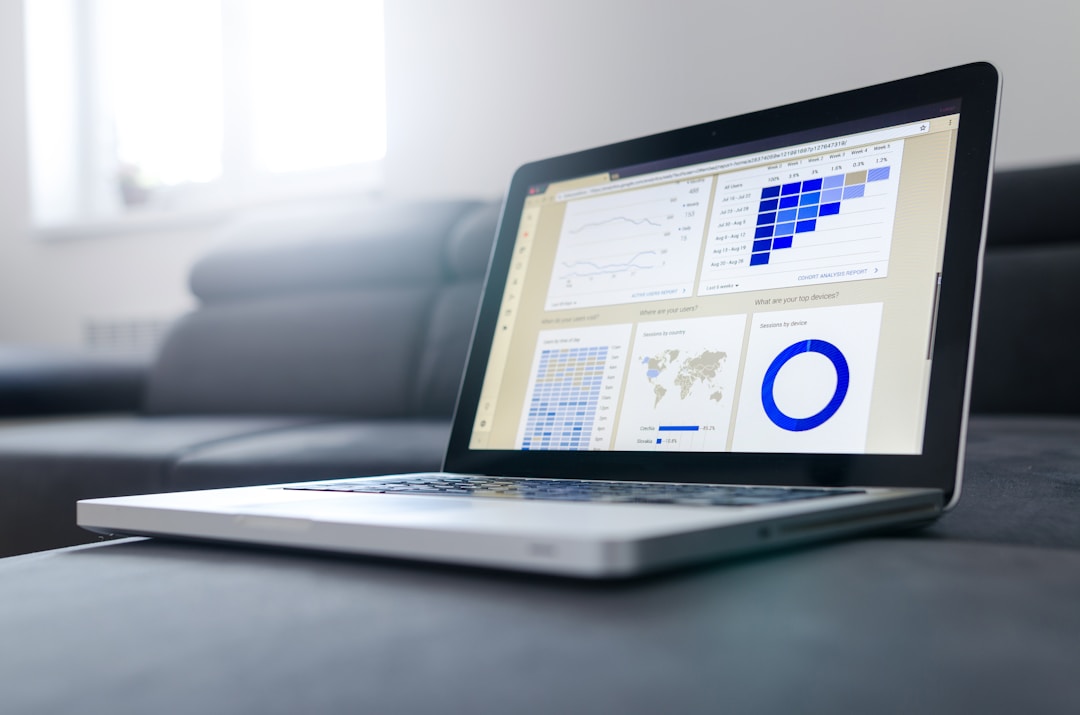
Many visualization software programs offer users real-time information, which business professionals can use to create advanced predictive analytics for sales.
For example, visualization software can provide your decision-makers with information as to why certain products are performing better than others and why they’re popular with target customers or not.
These analytics give your company’s decision-makers quick, easy access to your up-to-date sales figures and help them determine a strategy to increase these figures.
Modern Software for Modern Businesses
The whole point of data visualization is finding the correct information to help your team make the right decisions. However, sifting through this data can be impossible as more and more data flows in from myriad sources.
With real-time data visualization software, you can create advanced predictive analytics for the various aspects of your business. As a result, these real-time visuals allow users to make projections based on up-to-date data and help to improve marketing strategies.
Visualization software is a must-have for any modern business. These tools create faster insights, more effective communication, and real-time data for sales analysis.


