Business
GBP/USD’s Crash And Bounce Chart

There are plenty of trading opportunities for short-term speculators when volatility is high
Sterling plunged nearly 5% to a record low against the US dollar when Asian markets opened.
Traders priced in the possibility of a big rate hike from the Bank of England in an unscheduled meeting, so the downbeat currency bounced back.
The GBP/USD is still very volatile, but if you’re a short-term day trader, this will offer plenty of tradable opportunities.
In a minute, we’ll talk about a couple of tactical trade ideas, but first let’s review why GBP/USD is so weak.
First, the pound is weak, but the dollar is strong (as not all GBP pairs are at record lows).
They worry that the new Chancellor of the Exchequer’s fiscal policies will send inflation and government debt even higher. In the last few days, UK borrowing costs-or government bond yields-have jumped sharply higher.
Due to the pound’s declines, traders are now concerned that the government might announce a Japan-style intervention or that the Bank of England might increase rates unexpectedly.
BoE rate hikes by November are priced in at 175 basis points!
Volatility is likely to remain high for a while.
Following the cable’s massive drop and remarkable recovery from its overnight lows, let’s discuss the bullish and bearish cases.
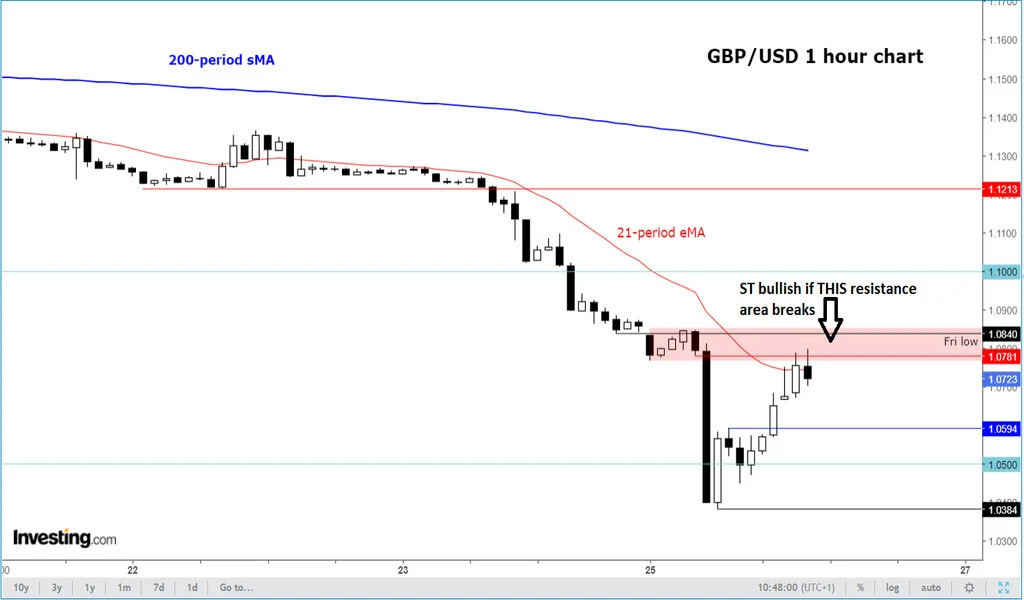
After a mini flash crash at the Asian open, the GBP/USD recovered more than 450 pips (~4.4%) off its lows by mid-morning London time.
At the time of writing, it was testing 1.08 again. As the breakdown point overnight, this is an important technical area for day traders.
Until something changes, the bears will offer the GBP/USD at short-term resistances. Should the GBP/USD keep falling from around 1.08, then the overnight low at 1.0594 is the only obvious support level.
A second wave of buying took out an interim high around 1.0594. If the GBP/USD starts falling again, it may act as support.
If it doesn’t, then the next bearish target will be liquidity below the overnight low of 1.0384, beyond which there are no prior levels. Next, we’ll talk about 1.02, 1.01, and then parity.
Since prices are severely oversold on the higher time frames, the bulls will also be looking for opportunistic long trades. Cable may have formed an interim low, they believe.
A break above the shaded region on the chart, namely between 1.0781 (last support pre breakdown) and 1.0840 (Friday’s low), will confirm this.
The 1.10 handle is likely to trigger another wave of short-covering.
Today, the sellers’ line in the sand is around 1.0840, which was Friday’s low. If it moves above it, the GBP/USD daily chart (not shown) will start showing a doji/hammer candle.
The bulls will only be able to buy the GBP/USD then. The market will remain sellers’.
SEE Also:
For 5 Years, LinkedIn Ran Social Experiments On Over 20 Million Users
Economist in Thailand Predict Baht to Plummet Further in 2022
Asian Stocks and Currencies Drop Over US Recession Fears


